The Costco Roadshow Reporting and Analytics CPG Brand 2026 Guide: How to Measure What Happened, Why It Happened and What to Do Next

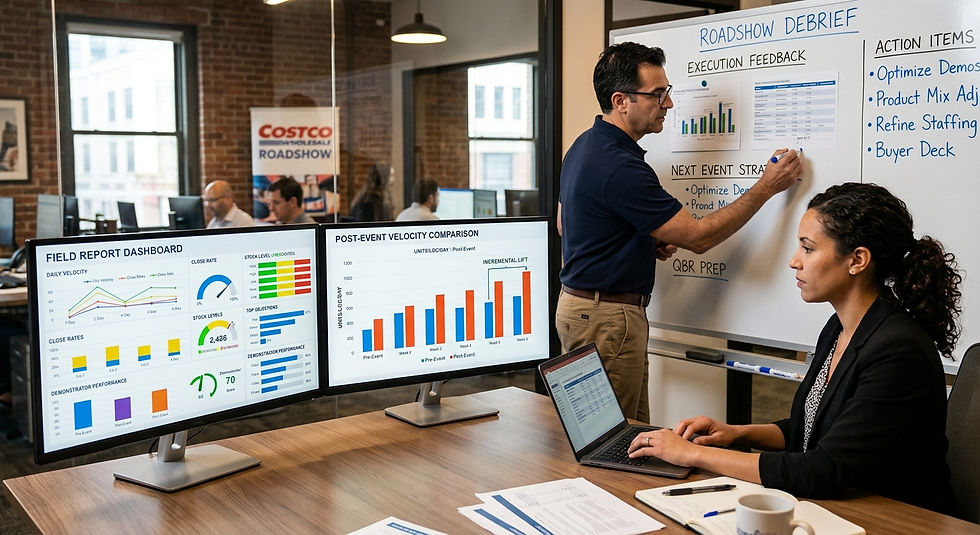
The Costco roadshow reporting and analytics CPG brand 2026 imperative is this: a four-day roadshow event that generates 28 units per location per day is not the same commercial outcome as a four-day roadshow that generates 28 units per location per day. The number is the same. The commercial intelligence it contains is not.
The first event might have generated 28 units per day because the demonstrator's talk track was exceptionally persuasive and the product's sample experience converted at 40 percent of engaged conversations. The second might have generated 28 units per day despite the demonstrator struggling with a talk track that confused rather than converted — because the product's warehouse floor presence and the member community's prior social media awareness drove most of the purchasing without the demonstrator's contribution.
These two events require completely different commercial responses. The first tells the brand that the demonstrator's talk track is a replicable asset worth documenting and standardizing. The second tells the brand that the demonstrator briefing process needs significant investment before the next event, and that social media pre-seeding is a genuine velocity driver worth investing in before future events.
The reporting and analytics framework that distinguishes these two commercial situations — and that converts the raw velocity number into the commercial intelligence that drives better decisions — is the difference between a brand that repeats the same roadshow event indefinitely and a brand that systematically improves every roadshow event's performance through structured measurement and deliberate iteration.
The Six-Metric Field Report: The Commercial Foundation
What to Capture During the Event
The roadshow field report must be completed daily — not at the event's end, not from memory after the demonstrators have departed, but at the close of each selling day while the specific interactions are still fresh and the daily velocity data is still disaggregated by shift and hour.
The six metrics that constitute the commercially complete daily field report:
Metric 1: Close Rate on Engaged Conversations
The close rate is the percentage of members who engaged substantively with the demonstration — who stopped, tasted the sample, and engaged in at least 30 seconds of conversation with the demonstrator — who subsequently placed the product in their cart.
The close rate formula: units sold during the shift ÷ substantive member engagements during the shift = close rate percentage.
The close rate is the single most commercially diagnostic metric in the roadshow field report because it disaggregates the velocity number into its two components: traffic (how many members engaged) and conversion (what percentage of engaged members purchased). A 28-unit-per-day event with a 45 percent close rate is a fundamentally different commercial situation than a 28-unit-per-day event with a 15 percent close rate.
The 45 percent close rate with lower traffic means the demonstrator's conversion is strong but the demonstration table's stopping power is weak — the member who stopped was almost certainly going to buy, but not enough members stopped. The corrective action: improve the demonstration table's visual stopping power, the demonstrator's opening line, and the product's display prominence.
The 15 percent close rate with higher traffic means the demonstration table is stopping members effectively but the demonstrator's conversion talk track is not closing — many members are engaging but few are buying. The corrective action: demonstrator talk track revision, additional sample quality evaluation, and price-point concern assessment.
Metric 2: Stock Health by Hour
The stock health metric tracks the product's available inventory at the demonstration table and on the nearby warehouse floor pallet by hour — identifying the specific periods when the product ran low or ran out during the event day.
The stock health commercial intelligence: a product that runs out at 2 PM on Saturday at a busy location communicates that the reorder quantity for that location was set too low based on the actual selling rate. The brand that tracks stock health hourly can calculate the units lost to out-of-stock conditions during the event — the sales that would have occurred if inventory had been maintained, quantified as the hourly selling rate multiplied by the hours of stock-out.
The out-of-stock loss calculation: 8 units per hour × 3 hours of stock-out = 24 lost unit opportunities. At the product's retail price, this is quantifiable lost revenue that appears nowhere in the raw daily velocity figure but represents a genuine commercial gap that better inventory management would have captured.
Metric 3: Top Three Member Questions
The specific questions that members ask most frequently at the demonstration table communicate the product's specific knowledge gaps — the information that the member needs but that the club-pack packaging does not provide effectively enough to convert without the demonstrator's verbal explanation.
The member question commercial intelligence: if the most common member question is "how much protein is in this?" and the product's protein content is displayed on the nutrition facts panel but not on the primary display panel at 4-foot legible scale, the question is communicating a packaging deficiency rather than a member information deficit. The corrective action: add the protein content as a front-of-pack hero claim in the club-pack's next FRS design review.
If the most common member question is "where else can I buy this?" the question is communicating channel curiosity that the demonstrator can convert into a direct-to-consumer or Amazon purchase pathway referral — expanding the event's commercial reach beyond the warehouse floor purchase.
Metric 4: Top Two Objections and How They Were Answered
The objections that members raise at the demonstration table — and specifically the way that experienced demonstrators successfully resolved those objections — are the commercial intelligence that the talk track standardization process requires.
The objection commercial intelligence: the objection "this is too big a quantity for my household" at a 48-count product is the format concern that the variety pack format adaptation addresses. The objection "the price is higher than what I'd pay at Whole Foods" is the value comparison objection that the per-unit price comparison talk track resolves. The objection "I'm on a special diet" is the dietary compatibility objection that the specific ingredient profile and certification credential talk track addresses.
The demonstrator who handles the "too expensive" objection by leading with the per-unit price comparison — "it looks like $38 but that's $0.79 per serving versus $2.50 at Whole Foods" — and converts the objector into a purchaser is providing the commercial intelligence that makes every future demonstrator more effective at the same objection.
Metric 5: What Stopped Members Most
The stopping mechanism — the specific element of the demonstration setup that caused members to pause their shopping trajectory and engage — is the commercial intelligence that the demonstration table design process requires.
The stopping mechanism categories: sample aroma, visual display, verbal opening from the demonstrator, product packaging aesthetics, the demonstrator's personal energy and engagement, and the specific product display's novelty or visual distinctiveness.
Understanding what stops members allows the brand to amplify the most effective stopping mechanism across all future events — and to identify when the stopping power is insufficient relative to the close rate, suggesting that the demonstration table's visual design needs enhancement.
Metric 6: Operational Issues
The specific operational issues that affected the event's commercial performance — power supply problems, placement position relative to traffic flow, restock delays, demonstrator no-show or late arrival, equipment failure — are the logistics intelligence that prevents the same operational failure from repeating.
The operational issue log is not a complaint register. It is a commercial optimization tool — the field intelligence that the event operations team uses to improve setup, placement negotiation, demonstrator management, and equipment reliability for future events.
The CMO View vs. The Field View: The Two-Layer Reporting Structure
Why One Report Cannot Serve Both Audiences
The Costco roadshow generates two types of data that serve two fundamentally different commercial audiences — and the brand that produces one report for both audiences is producing a report that is simultaneously too detailed for the CMO and too aggregated for the field operations team.
The CMO View: The Three-Number Narrative
The CMO or brand founder who needs to assess the roadshow's commercial performance and make investment allocation decisions needs three numbers with strategic context:
Units per location per day versus benchmark: the velocity number compared to the category benchmark (typically 25 to 30 UPD for an established product) and the brand's own prior event history. Is this event performing above, at, or below expected performance?
Incremental velocity lift versus pre-event baseline: the post-event velocity in the two to four weeks following the event versus the two to four weeks before the event — the true commercial impact that persists after the demonstrators have left.
Close rate trend versus prior events: the close rate at this event versus the prior comparable event — communicating whether the demonstrator briefing investment, the talk track revision, or the product formulation change improved conversion performance.
These three numbers with strategic context — "we performed 18 percent above benchmark, generated a 12 percent post-event velocity lift, and improved close rate from 31 to 38 percent versus our prior comparable event" — is the CMO-level roadshow performance narrative that drives investment allocation decisions without requiring the CMO to navigate field report granularity.
The Field View: The Six-Metric Dashboard
The field operations team that is briefing demonstrators, managing logistics, and optimizing event performance in real time needs the complete six-metric daily field report — the granular operational data that enables daily adjustments within the event and systematic improvements across future events.
The field view's specific commercial function: the demonstrator briefing for day three of a four-day event should incorporate the insights from days one and two's field report — the top questions that day one's members asked, the objections that day two's demonstrators handled most effectively, and the stopping mechanism that generated the highest traffic on day one's morning shift.
The brand that debriefs the demonstrator team between event days — using the field report data to improve talk track, address identified questions proactively, and reinforce effective stopping mechanisms — generates a day three performance that is meaningfully better than day one's because the field report's intelligence has been applied in real time.
The Post-Event Velocity Analysis: The Event's True Commercial Impact
The Two-Week Holdout Comparison
As described in the trade spend ROI guide, the roadshow event's true commercial impact extends beyond the event period — the members who were exposed to the product but did not purchase at the event (because they were not ready, because the event timing did not align with their shopping occasion, or because they wanted to check reviews first) who subsequently purchase during warehouse visits in the weeks following the event.
The post-event velocity analysis framework:
Pre-event baseline velocity: the warehouse's units per location per day in the two weeks before the event began. This is the product's organic warehouse floor velocity without demonstration support.
Event-period velocity: the units per location per day during the four-day event. This velocity includes both the demonstration-converted purchases and the organic warehouse floor purchases that would have occurred regardless.
Post-event velocity: the units per location per day in the two weeks following the event's conclusion. This velocity reflects the lasting commercial impact of the event — the organic purchasing by members who discovered the product at the demonstration but purchased later.
The post-event velocity lift calculation: (post-event UPD − pre-event UPD) ÷ pre-event UPD = post-event velocity lift percentage.
A product whose pre-event baseline velocity was 18 UPD, whose post-event velocity rises to 22 UPD, has generated a 22 percent permanent velocity lift from the roadshow event — a commercial outcome that appears nowhere in the event-period velocity figure alone.
The Velocity Decay Curve
Not all post-event velocity lifts are permanent. Some events generate a velocity spike in the two weeks immediately following the event — driven by members who saw the demonstration but returned on their next warehouse trip — followed by a gradual return toward the pre-event baseline as the demonstration's commercial impact fades from memory.
The velocity decay curve — the trajectory of post-event velocity from the event's immediate aftermath through the eight to twelve weeks following — communicates the specific commercial durability of the event's impact. The event that generates a permanent 22 percent velocity lift has created a genuinely improved organic demand level. The event that generates a two-week spike followed by a return to baseline has created temporary commercial excitement without durable demand improvement.
The permanent lift versus temporary spike distinction drives the commercial decision about roadshow event frequency: the brand whose events generate permanent velocity lifts may need fewer events to sustain the program's above-benchmark performance, while the brand whose events generate temporary spikes may need more frequent events to maintain the elevated velocity that the buyer's scorecard requires.
The Buyer QBR Data Package: Converting Field Intelligence Into Commercial Currency
The Three-Element QBR Roadshow Package
The roadshow field report data's highest commercial application is the buyer QBR — where the brand uses the event's commercial intelligence to demonstrate the quality of its commercial execution and to justify the forward roadshow calendar request.
The three-element roadshow data package for the QBR:
Element 1: Event performance summary. The CMO-view three-number narrative — velocity versus benchmark, post-event lift, and close rate trend — presented as the buyer-facing evidence of commercial execution quality.
Element 2: Member intelligence insights. The specific member questions and objections from the field report, presented as category intelligence that the brand has developed through direct member engagement — the specific consumer insights that the buyer's own data cannot capture at the individual interaction level.
Element 3: Forward event recommendation. Based on the event performance data, the specific next event proposal — the locations where the post-event velocity lift was highest (suggesting the strongest member community resonance), the seasonal timing that aligned with the highest traffic and close rate performance, and the specific demonstrator briefing improvements that the field report's intelligence supports.
The buyer who receives this three-element roadshow data package is receiving the commercial peer's analytical contribution — the brand's specific consumer intelligence that complements the buyer's own category data rather than merely presenting sales numbers and requesting schedule approval.
At Fractional Brand Managers, we build the complete Costco roadshow reporting and analytics infrastructure for CPG brand clients — field report templates, demonstrator briefing protocols, post-event velocity analysis, the CMO versus field view reporting structure, and the buyer QBR data package that converts roadshow field intelligence into commercial currency at the most important meeting in the buyer relationship calendar.
Contact us at 732-433-7873 or info@fractionalbrandmanagers.com.
Costco Roadshow Reporting Framework 2026 — Complete Structure:
Report Layer | Audience | Key Metrics | Commercial Function |
Daily field report | Field ops + demonstrator team | Close rate, stock health, top questions, top objections, stopping mechanism, ops issues | Real-time event optimization + demonstrator briefing improvement |
CMO view | Brand founder, CMO, investors | Velocity vs. benchmark, post-event lift, close rate trend | Investment allocation decisions |
Post-event velocity analysis | Commercial team + buyer | Pre/event/post UPD comparison, decay curve | True ROI measurement, permanent vs. temporary lift identification |
Buyer QBR package | Costco buyer | Performance summary + member intelligence + forward recommendation | Roadshow calendar authorization + category development partner positioning |
The close rate diagnostic:
High close rate + low traffic → improve stopping power (visual, opening line, product display)
Low close rate + high traffic → improve talk track (conversion language, objection handling)
Low both → comprehensive demonstrator briefing + demonstration setup redesign
The permanent lift signal: Post-event UPD above pre-event baseline beyond 4 weeks → durable demand improvement → evidence of genuine new member base growth
The field report timing rule: Complete daily — not at event end. Granular data degrades rapidly from memory within 24 hours of each shift.
#CostcoRoadshowReportingAnalyticsCPGBrand2026 #CostcoRoadshowAnalytics2026 #CostcoRoadshowReporting #CostcoRoadshowData2026 #CostcoCloseRate
#CostcoRoadshowVelocity #CostcoDemonstratorBriefing #CostcoPostEventVelocity #CostcoQBRData #CPGRoadshowAnalytics2026 #FractionalBrandManagers
#CostcoChannel2026 #CPGBrands2026 #CostcoBuyer2026 #CPGRoadshow2026 #GetIntoCostco2026 #CPGStrategy2026 #CostcoRoadshowROI #Costcosales


Comments